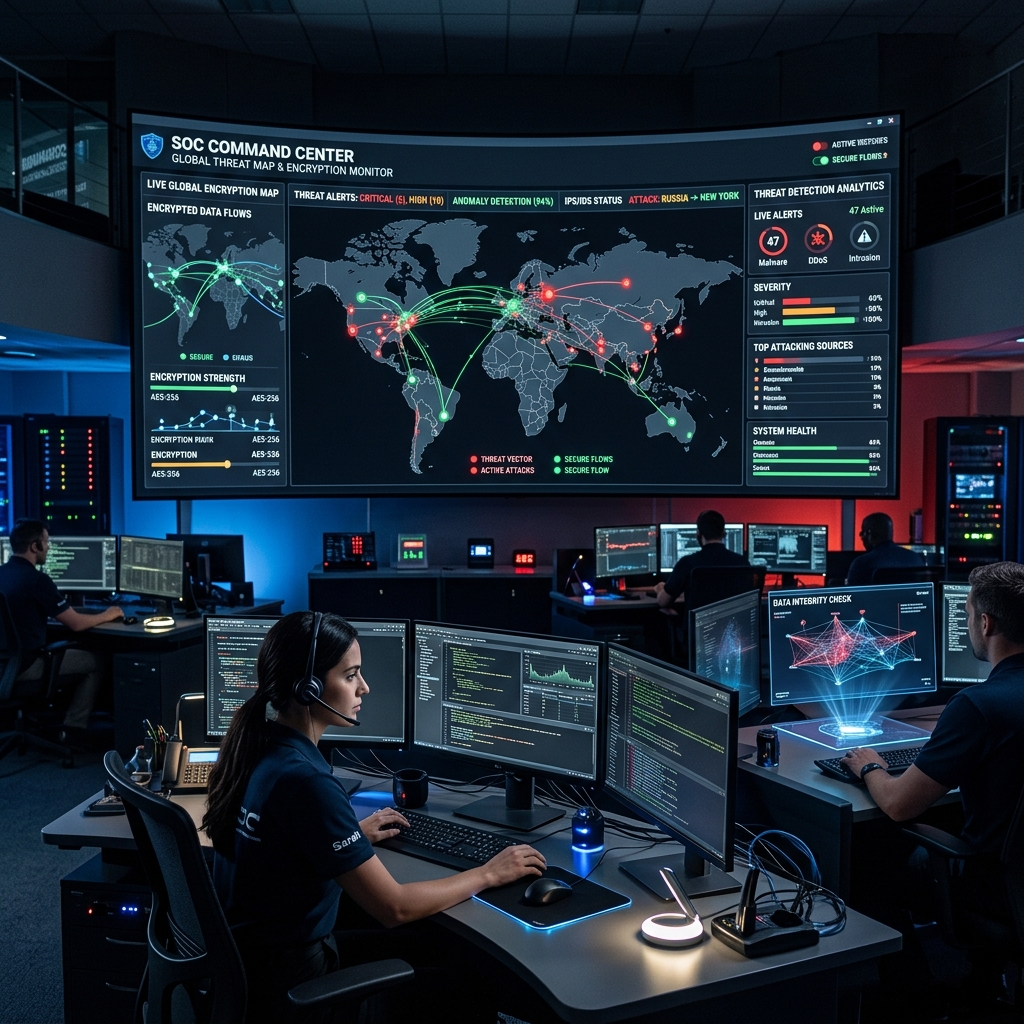

In a complex IT environment, "off-the-shelf" monitoring tools often provide too much noise and not enough signal. A generic dashboard might tell you a server is up, but it won't tell you if the latency on a specific API endpoint is affecting your customer's checkout speed. This is where Custom OCC (Operations Control Center) Dashboards become essential.
The Single Pane of Glass
The goal of a custom dashboard is to provide a "single pane of glass" view. DigNep integrates data from routers, servers, UPS units, and even climate sensors into a unified visual interface. This allows your team to see the correlation between a spike in room temperature and a drop in storage performance instantly.
Real-time Telemetry with WebSockets
Our dashboards don't just refresh every 5 minutes. We use WebSocket technology to provide sub-second telemetry. When a packet is dropped in your Data Center, you see it on the dashboard before the customer even notices a lag.
Role-Based Customization
Different teams need different data. A CEO needs a high-level view of uptime and cost, while a network engineer needs to see BGP flaps and port errors. Our custom software allows for different "Views" tailored to the specific KPIs of each department.
Visualizing the Topology
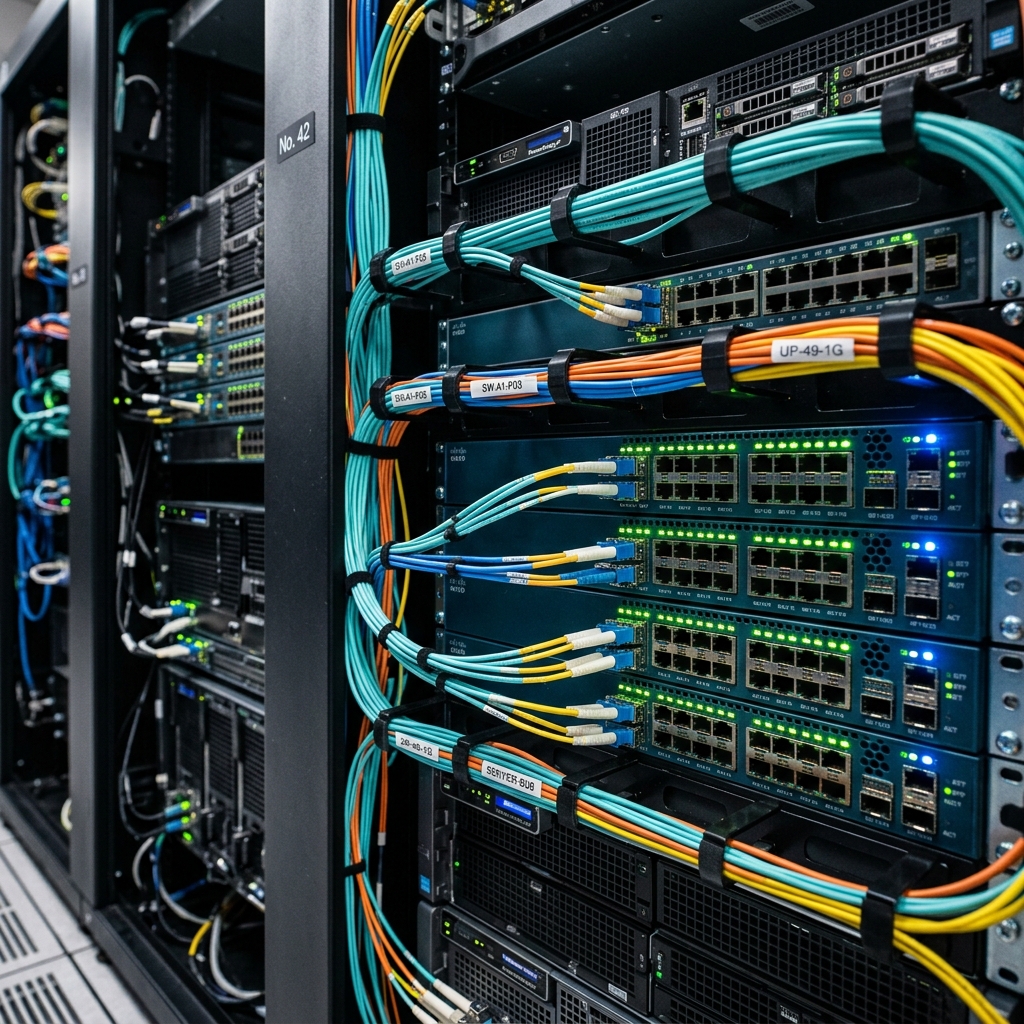
Beyond charts and graphs, we build interactive SVG maps of your physical infrastructure. You can click on a rack on your screen to see exactly which server is overheating and even remotely trigger a reboot or a fan increase.
Optimize your infrastructure with DigNep
Our technical board provides deep-dive audits and deployment strategies for high-performance enterprise networks.
Start Technical Audit →